Reading Matlab .mat format Dataset in Python
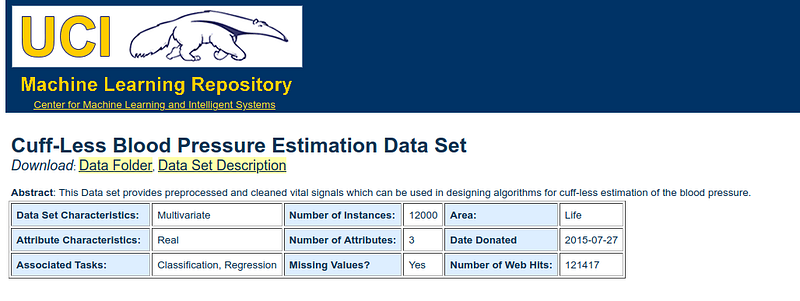
Cuff-Less Blood Pressure Estimation Data Set has a Matlab Dataset and I won’t use it in python code.
python
import pandas as pdpython
import numpy as nppython
import h5pypython
import matplotlib.pyplot as pltThis dataset using Matlab’s v7.3 mat file format furthermore the best solution to read this dataset is using h5py.
python
import h5pypython
filename = "./data/Part_1.mat"text
with h5py.File(filename, "r") as f:text
# List all groupspython
print(f.keys() )python
a_group_key = list(f.keys())[0]text
# Get the datapython
data = list(f[a_group_key])the result shows the header file
text
<KeysViewHDF5 ['#refs#', 'Part_1']>and then working with a dataset as NumPy
python
f = h5py.File('./data/Part_1.mat','r')python
test = f['Part_1']python
st = test[0][0] # has 3000 element #<HDF5 dataset "Part_1": shape (3000, 1), type "|O">python
st = test[0][0]python
obj=f[st]now obj is first pateint data
text
obj[:]text
array([[ 1.75953079e+00,  6.70629552e+01, -6.06060606e-02],       [ 1.71847507e+00,  6.93586281e+01,
-7.52688172e-02],       [ 1.68426197e+00,  7.53664529e+01, -7.03812317e-02],       ...,       [
1.64418377e+00,  7.64410232e+01, -1.00195503e-01],       [ 1.60019550e+00,  8.18138747e+01,
-9.04203324e-02],       [ 1.56598240e+00,  9.13873191e+01, -4.54545455e-02]])
text
obj.shapetext
(61000, 3)the dataset has 3 attributes
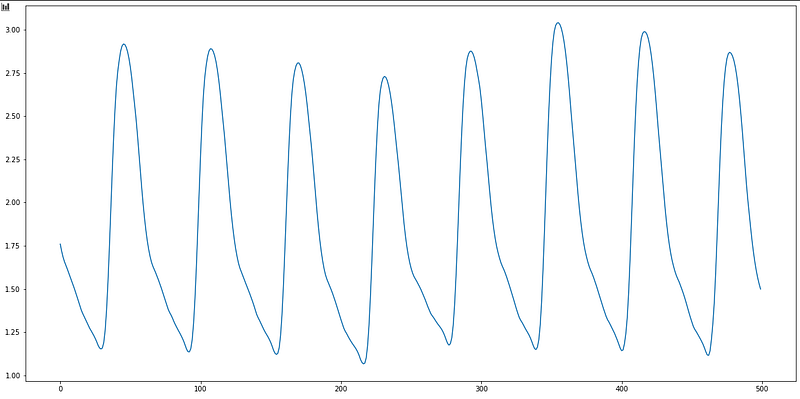
1: PPG signal, FS=125Hz; photoplethysmograph from fingertip
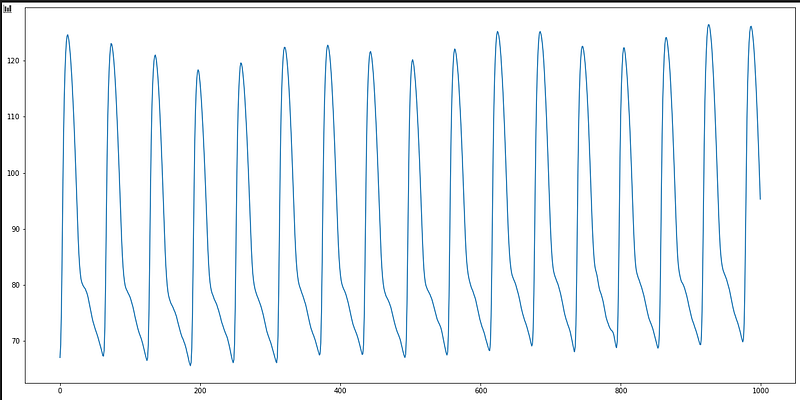
2: ABP signal, FS=125Hz; invasive arterial blood pressure (mmHg)
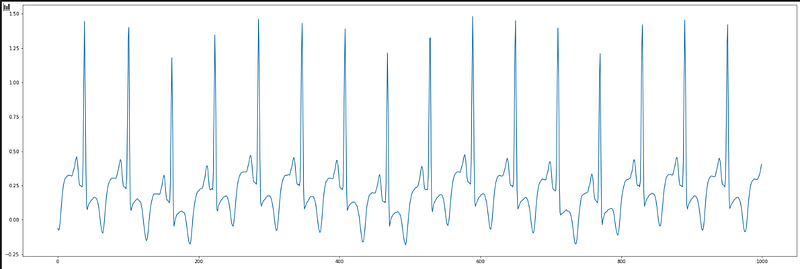
3: ECG signal, FS=125Hz; electrocardiogram from channel II