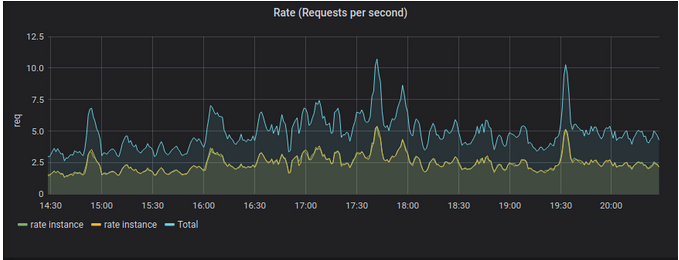
Generally monitoring micro-service is so essential. When the error occurred, we can’t easily find the issue in the whole system. Sometimes entire architecture is built with a lot of developers in different categories and we don’t know exactly which part of the application has a problem. It means that we should stop our pastimes to find a bug. As far as I’m concerned, Some bugs can be detected by open telemetry or tracing system, but sometimes other bugs are happened because of other parameters such as high TPS on the special endpoint. With regard to the monitoring system, we can observe the increasing number of requests on each endpoint. As you know database always is the bottleneck of each computer system and we can monitor our DB with Prometheus easily. In short, monitoring systems are the best way of understanding about measuring each endpoint and even understanding about total requests that have been received into our micro-services.
go-micro
micro.WrapHandler(prometheus.NewHandlerWrapper())monitor.go
var (MonitoringHttpDuration = promauto.NewHistogramVec(prometheus.HistogramOpts{
    Name: "http_duration_seconds", Help: "Duration of HTTP requests.",
}, []string{
    "path"
}) MyCounter = prometheus.NewCounter(prometheus.CounterOpts{
    Name: "mycounter_request_count", Help: "No of request handled by Qrcode KYC handler",
},)
)
func RegisterVariablePrometheus() {
    prometheus.MustRegister(MyCounter)
}
// prometheusMiddleware implements mux.MiddlewareFunc.
func PrometheusMiddleware(next http.Handler) http.Handler {
    return http.HandlerFunc(func(w http.ResponseWriter, r *http.Request) {
        route := mux.CurrentRoute(r) path, _ := route.GetPathTemplate() timer :=
        prometheus.NewTimer(MonitoringHttpDuration.WithLabelValues(path)) next.ServeHTTP(w, r)
        timer.ObserveDuration()
    })
}
main.go
RegisterVariablePrometheus()if useing net.http
mux := http.NewServeMux() mux.Handle("/metrics", promhttp.Handler())if using Golira
r.Use(prometheusMiddleware) r.Path("/metrics").Handler(promhttp.Handler())Metric names and labels
Every time series is uniquely identified by its metric name and optional key-value pairs called labels.
The metric name specifies the general feature of a system that is measured (e.g. http_requests_total - the total number of HTTP requests received). It may contain ASCII letters and digits, as well as underscores and colons. It must match the regex [a-zA-Z_:][a-zA-Z0-9_:]*.
app.NatsStreamProcessor.With(prometheus.Labels{“type”: “producer”, “stream”: “init”, “subject”: “”}).Inc()