How We Rebuilt a Telecom KPI Platform to Handle Billions of Records: From JSON Blobs to Flat Columns
Background
In large-scale telecom networks, Performance Management (PM) data is collected continuously from thousands of network elements — antennas, base stations, radio units — each reporting hundreds of counters every few minutes. The engineering challenge is not just storing this data, but making it fast and cheap to query for KPI calculations at scale.
This article describes how we redesigned our PM data platform from the ground up: replacing a JSON-string storage model with a flat columnar schema, removing real-time on-the-fly KPI calculations from the application layer, and introducing a Go-based backend that serves pre-calculated results. The result is a system capable of processing and querying billions of records efficiently.
Special Thanks to Hossein Banad
The Old Architecture: PM-Parser with JSON Strings
In the previous version, a component called pm-parser was responsible for reading raw PM files (delivered by network vendors) and loading the extracted measurements into ClickHouse. The design stored all measurement counters as a single JSON string in one column, alongside a timestamp and some cell identifiers:
| time                | cell_id   | vendor | technology | measurements
|
|---------------------|-----------|--------|------------|-------------------------------------------|
| 2026-05-15 10:00:00 | CELL_0001 | nokia  | LMBB       | {"ctr_1":1200,"ctr_2":980,...}     |
This approach was convenient at ingestion time — the parser simply serialized the entire measurement payload as a string and wrote one row per cell per timestamp. But it created severe problems downstream:
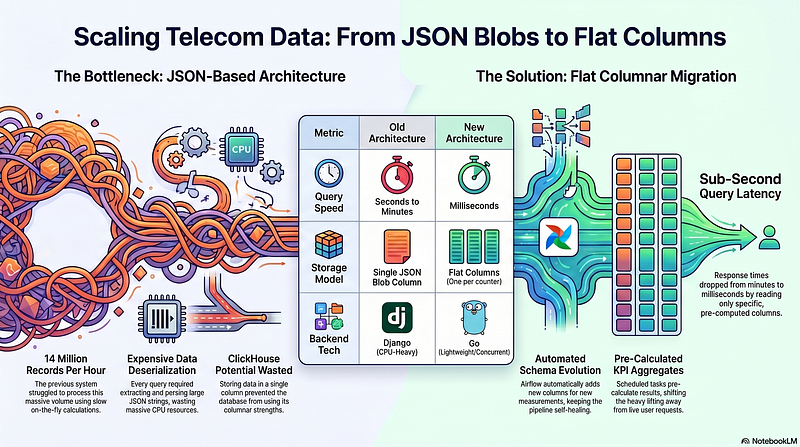
1. KPI calculation was expensive and slow. Every time the application needed to compute a KPI (for example, RRC Success Rate = ctr_rrc_succ / ctr_rrc_att * 100), it had to fetch the raw rows, deserialize the JSON string in application code, extract the relevant fields, and run the arithmetic. With 14 million records per hour flowing in, doing this on the fly was unsustainable — query times were long, and the backend became a resource bottleneck.
2. ClickHouse could not use its columnar strengths. ClickHouse is purpose-built for analytical queries on columnar data — it reads only the columns you need, compresses them efficiently, and runs vectorized operations. When all your measurements are packed into a single JSON string column, ClickHouse has to scan and deserialize that entire string for every row, even when you only need two counters out of two hundred. You lose all the benefits of the columnar engine.
3. Material Views were not viable at this throughput. An intuitive solution would be to use ClickHouse Materialized Views to pre-aggregate or flatten the JSON on insert. But at 14 million records per hour, Materialized Views introduce significant write amplification and synchronization overhead. In practice they simply could not keep up with the insert rate, causing lag and degraded query performance.
The New Architecture: Flat Columns, Airflow KPI DAGs, and Go Backend
The redesign addressed each of these problems with three coordinated changes.
1. Flat Columnar Storage
The core insight is simple: store each measurement counter as its own column. Instead of one row with a JSON blob, each row contains the base cell dimensions plus a dedicated Nullable(Float64) column for every counter:
| time                | cell_id   | vendor | technology | ctr_1       | ctr_2        | ctr_3      |
ctr_4       | ...
|
|---------------------|-----------|--------|------------|-------------|--------------|------------|-------------|-----|
| 2026-05-15 10:00:00 | CELL_0001 | nokia  | LMBB       | 1200        | 1150         | 430        | 418         | ... |
The target table uses MergeTree partitioned by day, ordered by (vendor, technology, time, cell_id). Each counter column is compressed with ZSTD(1) and uses sparse serialization (since many counters are null for a given cell in a given interval), keeping storage overhead manageable even with hundreds of columns.
Because the vendor schema evolves over time (new counters are added in new software releases), an Airflow step scans recent raw data, discovers any ctr_* keys present in the JSON that don't yet have a column, and issues an ALTER TABLE ... ADD COLUMN IF NOT EXISTS to extend the schema automatically. This keeps the pipeline self-healing without manual intervention.
Why this matters for performance: A KPI query that needs only ctr_rrc_att and ctr_rrc_succ now asks ClickHouse to read just two narrow columns out of two hundred. The I/O and CPU cost drops by roughly two orders of magnitude compared to scanning and parsing a JSON string column for every row.
2. Kafka for Ingestion Rate Control
To handle the 14 million records per hour insert rate reliably, a Kafka engine was added between pm-parser and ClickHouse. pm-parser publishes parsed records to Kafka topics. ClickHouse reads from these topics using its native Kafka table engine, which decouples the producer rate from the consumer commit rate, provides back-pressure, and gives replay capability if a downstream write fails.
This removes the bottleneck that Materialized Views introduced — inserts go through a controlled, buffered pipeline rather than triggering synchronous view maintenance on every write.
3. Airflow DAGs for Pre-Calculated KPIs
In the old system, Backend calculated KPIs on the fly at request time. Every API call triggered a database query, JSON deserialization, and arithmetic on millions of rows. Response times were slow and server load was high.
In the new architecture, Airflow DAGs run on a schedule (hourly) and pre-calculate all KPIs, writing the results into dedicated aggregation tables. The DAG processes data in sliding 10-minute windows, fetches the flat counter columns directly, computes the KPI formulas, and writes compact result rows. Because this runs asynchronously in the background, query times for end users become trivially fast — they are reading pre-computed numbers, not triggering live aggregation.
The Airflow pipeline for the flat ingestion step itself (shown in the code above) runs three stages in sequence:
- DDL Initialization — ensures the flat target table exists with the correct schema.
- Schema Sync — scans recent raw data, discovers new counter keys, and adds missing columns.
- Sliding-Window Ingestion — fetches raw rows in 10-minute chunks, deserializes the JSON measurements in Python, and inserts flattened rows into the target table.
4. Go Backend for KPI Serving
The backend was replaced with a Go service whose only responsibility is serving pre-calculated KPI results from the aggregation tables. Go’s low memory footprint and high concurrency make it well-suited for read-heavy API workloads. Since the backend no longer runs any calculation logic — it simply queries a result table and returns the data — the service is lightweight and horizontally scalable with minimal resources.
Results and Impact
The combination of these changes produces compounding performance gains:
Concern Old Architecture New Architecture Measurement storage JSON string, one column Flat columns, one per counter ClickHouse column scan Full JSON blob per row Only queried columns read KPI calculation timing On-the-fly at request time Pre-calculated by Airflow Insert rate handling Materialized Views (too slow) Kafka engine with buffering Backend technology Django (CPU-heavy) Go (lightweight, fast) Query response time Seconds to minutes Milliseconds
Storing measurements as flat columns means ClickHouse can apply vectorized aggregation directly on native Float64 columns rather than deserializing strings. Combined with the ZSTD compression and sparse serialization, storage costs remain acceptable even as the number of counter columns grows into the hundreds.
Pre-calculating KPIs removes the most expensive computation from the request path entirely. The database does the heavy lifting once per hour, in the background, and serves every subsequent request from compact result rows.
At 14 million records per hour — over 336 million records per day, approaching 10 billion records per month — this architecture sustains stable ingestion, fast schema evolution, and sub-second KPI query latency.
Key Lessons
Flat beats nested at analytical scale. JSON columns are convenient for flexible schemas, but they trade away the columnar performance that makes ClickHouse fast. If you know your access patterns involve aggregating specific counters, store them as columns.
Push computation to scheduled pipelines, not request handlers. On-the-fly aggregation of billions of rows is expensive regardless of the database. Pre-aggregating with Airflow and serving results with a thin Go layer separates concerns cleanly and lets each component do what it is best at.
Control your insert rate explicitly. At tens of millions of records per hour, any synchronous write-time processing (materialized views, triggers, inline transforms) becomes a liability. Kafka provides the buffer and decoupling needed to absorb bursts and maintain stability.
Schema evolution does not have to be manual. Telecom vendors ship new PM counters in software updates without warning. Automating schema discovery and ALTER TABLE in the ingestion pipeline keeps the system self-maintaining and prevents data loss from unmapped fields.
Conclusion
In summary, the transition from a JSON-string storage model to a flat columnar architecture has fundamentally transformed the platform’s ability to handle the massive scale of telecom performance data. By moving away from expensive, on-the-fly calculations and embracing ClickHouse’s native columnar strengths, the system successfully addressed the bottlenecks of the previous architecture.
The implementation of flat columns with automated schema evolution, Kafka-buffered ingestion, and pre-calculated KPIs via Airflow has resulted in a high-performance pipeline capable of processing roughly 10 billion records per month. This redesign shifted query response times from minutes to milliseconds, demonstrating that pushing computation to scheduled pipelines and serving results through a lightweight Go backend is far more efficient than request-time aggregation.
Ultimately, this project highlights a critical lesson for large-scale analytics: flat beats nested. While JSON blobs offer initial convenience, optimizing for a database’s columnar strengths and decoupling ingestion from processing are the keys to building a self-healing, stable, and highly scalable KPI platform.
Visit us at DataDrivenInvestor.com
Subscribe to DDIntel here.
Join our creator ecosystem here.
DDI Official Telegram Channel: https://t.me/+tafUp6ecEys4YjQ1